Traffic monitoring can help you discover performance and security issues, fine-tune your application, and enable or restrict some features. This type of testing is beneficial for all types of applications, but for cloud-based ones, it’s a must.
In this article, we share Apriorit’s experience of using Fiddler and Charles web debugging proxies to monitor HTTP/HTTPS traffic when testing applications. You’ll find out when to use these tools, what are their advantages, and how to set up and start working with them.
This article will be useful for quality assurance (QA) teams who are looking for ways to efficiently monitor the traffic of their applications.
The role of proxy servers in application testing
A proxy server acts as an intermediary between your endpoint, such as a PC or a smartphone, and the server you’re trying to connect to. With the help of a proxy server, you can access a service that’s only available to users in a specific region or bypass an IP address lock.
It’s noteworthy that proxy servers are protocol-specific, so you’ll need different proxies for working with different types of protocols. Applications and cloud services, for instance, usually interact using the HTTPS protocol.
At Apriorit, we have vast experience in testing cloud-dependent applications that interact with cloud storage services such as iCloud and Google storage. For monitoring HTTPS traffic between the application under test and a third-party cloud service, you’ll need a special web debugging proxy.
For the purposes of application testing, you can use proxies to:
- log and analyze traffic between the tested application and the server
- edit application requests and server responses
- change internet connection bandwidth.
Of course, what you can do depends on the tool you’re using.
For instance, you can use a traditional proxy server to check application performance and availability at different locations. This is especially important for applications that are dependent on third-party services.
In most cases, testers don’t know where geographically a user will run the application, and therefore they don’t know for sure which third-party cloud storage server the application will have to connect to. And since the behavior of cloud storage services differs from one region to another, this must be taken into account when testing a cloud storage-dependent application.
You can use a proxy server for a specific application only or to monitor traffic of all applications connected to the internet.
Here’s what you need to do in Windows 10 to change your computer’s global settings and make all traffic from every internet-connected application pass through the proxy:
Start> Windows Settings> Network & Internet> Proxy
Enable the option Use a proxy server, enter the address and the port, then click Save.
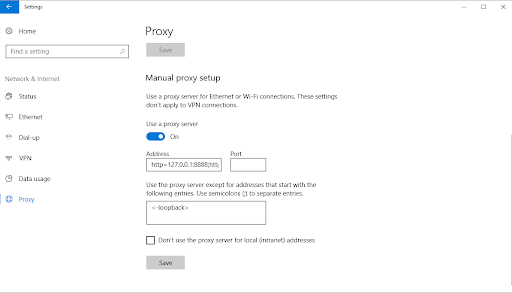
The IP addresses of different proxy servers can be found on the internet. There are plenty of both free and paid resources with different locations, encryption, and anonymity settings.
Here are some of the popular paid proxies you might use:
You can also try to find a proxy server in this database of free online proxies.
Next, we take a look at two tools that our Apriorit testers often work with – Fiddler and Charles.
Need to test a cloud-based application before release?
Reach out to Apriorit’s QA team to check your application’s performance, security, code quality, and other parameters. We’ll help you deliver the best version of your product under a reasonable budget.
Monitoring HTTPS application traffic with Fiddler
Fiddler is a web debugging tool for analyzing HTTP/HTTPS traffic between your computer and a remote server. When it comes to application testing, you can use this tool to:
- examine sessions
- inspect the performance of particular features
- test web APIs.
Session inspection, for instance, helps testers make sure that all sensitive data used by the application under test is encrypted properly before it’s sent over the internet. Fiddler also allows you to change or substitute application requests and server responses if necessary.
To monitor and edit HTTP/HTTPS traffic, you can use the desktop version of Fiddler or the mobile application. To work with the mobile app, you’ll need to install a root certificate on your smartphone or tablet. This option is rather helpful in stress testing development on iOS and Android. To learn more about security testing of Android solutions, check out our article on Android app pentesting.
Let’s see the basic settings for using Fiddler.
Read also
9 Best Reverse Engineering Tools for 2023 [Updated]
Discover how to use Fiddler and other tools for reverse engineering, which can help you deeply understand software and find improvement possibilities that other tools and approaches can overlook.
Setting up Fiddler
When Fiddler launches, a window opens with the registered server requests on the left and the work tabs on the right:
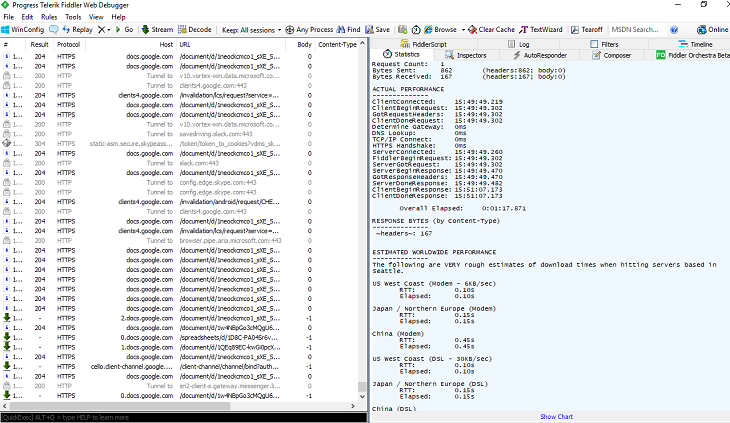
In the window on the left, you can select requests, see their headers, and save them to the system together or separately.
To configure Fiddler, you need to run it with administrator rights, disable Capture traffic, and select Tools> Options> HTTPS:
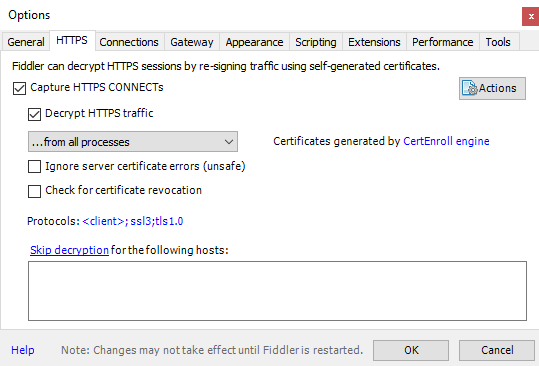
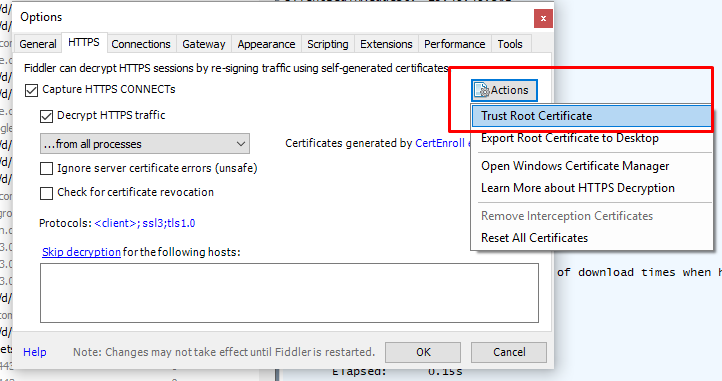
Next, you need to select the Decrypt HTTPS traffic option. You may also need to click on the Actions icon on the right and choose the Trust Root Certificate option. Otherwise, Fiddler won’t be able to capture HTTPS traffic on your computer.
In the Rules> Automatic Breakpoints menu, you can enable automatic interruption of Fiddler when processing a request. After that, if you make a request in the browser, or in our case to the application connected to Fiddler, the execution of this request will hang, and the request will be marked with a special icon in the left part of the Fiddler window.
For application testing to be as explicit as possible, testers must have tons of different test accounts and various types of requests and responses at hand. In some cases, you may need to manually substitute the server response before sending it to the application or change the request coming from the application.
Changing responses from the server allows you to:
- simulate different error codes in server responses
- edit and damage the files received by the application in server responses.
In order to change the server response, you need to take the following steps:
- Select the request that needs to be changed from the list.
- Set a breakpoint for the request (you can skip captured but unsuitable requests using Run to Completion).
Note: In order for Fiddler to intercept only traffic to and from the application under test, right-click on the selected request and choose Filter Now> Show only Process (the process of our application).
- Find the right request among intercepted requests.
- Click Break to Response.
- Edit the response data in the TextView tab.
- Send the corrected answer by clicking Run to Completion.
- Remove the breakpoint in Rules> Automatic> Breakpoint> Disabled.
- Check the results.
If the server response comes with a file, for example in *.xml format, then you won’t be able to simply edit the data in the TextView tab. You can, however, replace the entire file in the server response.
In order to replace the file, you must do the following:
- Select the intercepted request you need (breakpoints are pre-configured).
- In the Session Inspector tab, find the Choose Response… drop-down list.
- In this list, select the file (or type of error) that you want to replace the server response with.
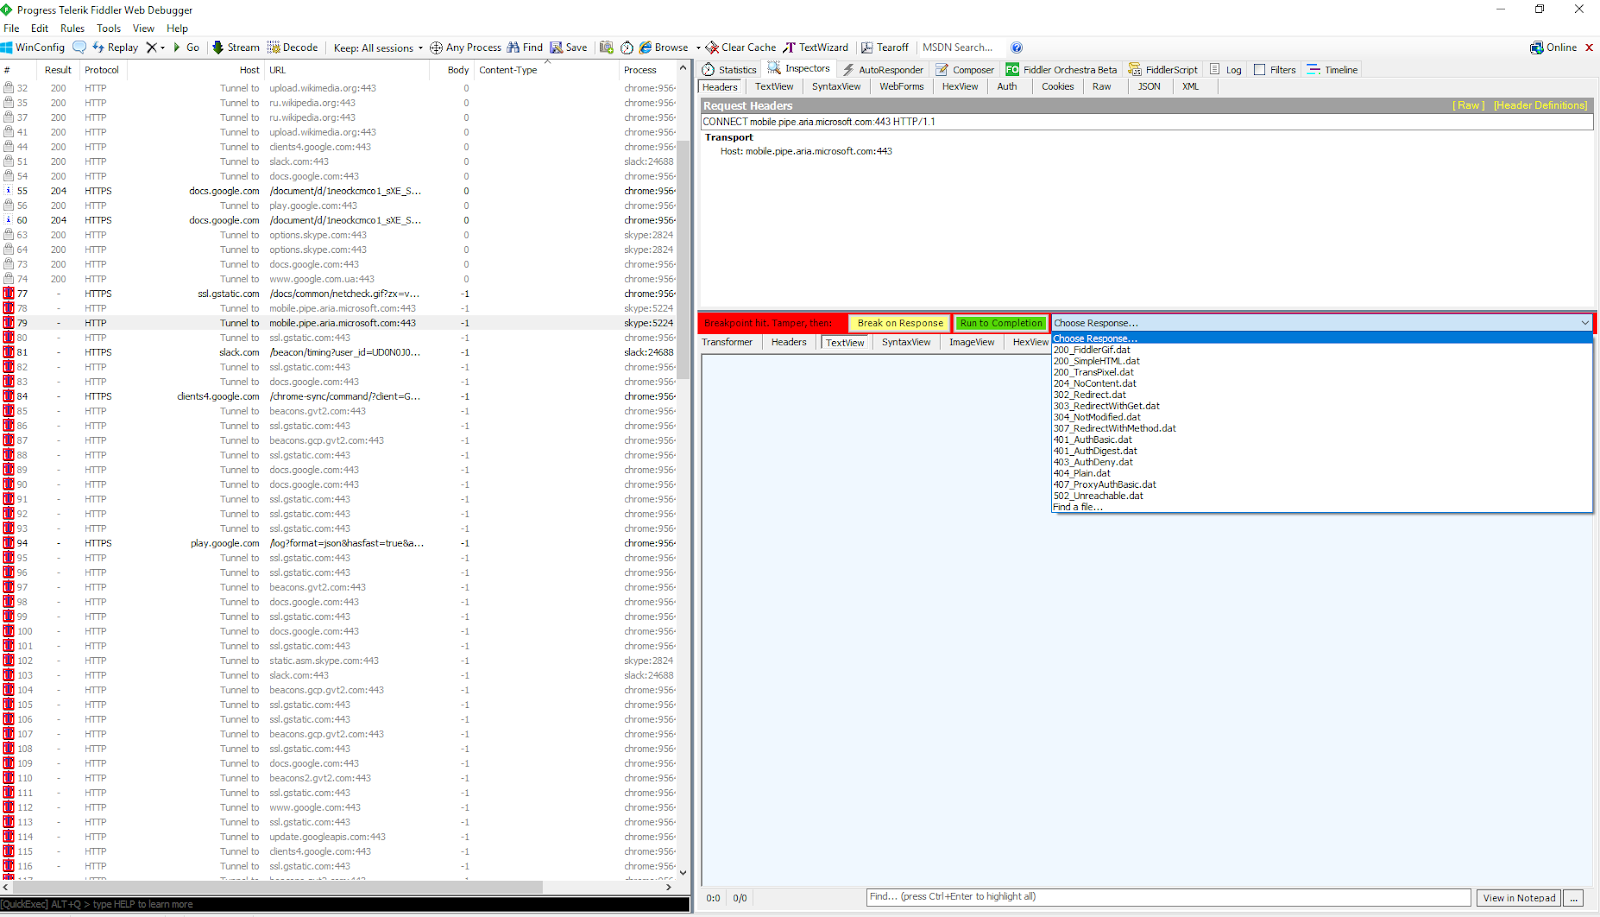
- Click Run to Completion to apply the response changes.
- Check the results.
To learn more about Fiddler, you can read the detailed manual on the official website. However, Fiddler isn’t the only tool you can use for monitoring HTTP/HTTPS traffic.
In the next section, we take a closer look at the second tool that our testers and developers often use for monitoring application traffic: Charles.
Related project
Developing a Custom ICAP Server for Traffic Filtering and Analysis
Explore how we helped our client add file sanitizing via the Internet Content Adaptation Protocol (ICAP) to their SaaS platform, helping them to attract new customers and increase revenue.
Monitoring HTTPS application traffic with Charles
Charles is a popular tool for monitoring HTTP and SSL/HTTPS traffic. The program works as a proxy server between the application (client) and the server. Charles records and saves all requests that pass through the device connected to it and allows you to edit and replace them.
When testing an application, you can use this tool to:
- monitor encrypted traffic sent over HTTPS
- analyze all data sent to or received by a device running iOS or Android
- substitute or edit application requests and server responses
- adjust the latency and bandwidth of the internet connection.
Charles can also be used to create a reverse proxy for debugging SSL web applications.
Below, we describe basic Charles settings for monitoring application traffic from an iOS device.
Setting up Charles
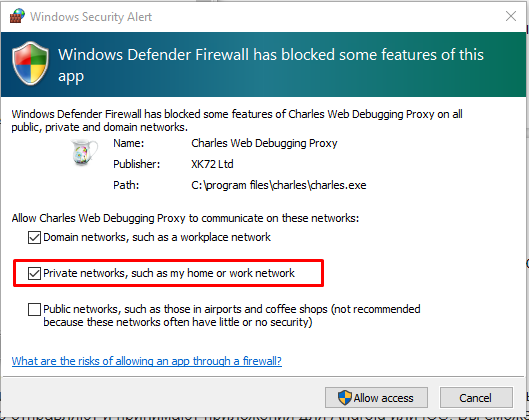
After installing Charles on your computer, you may need to grant access permission:
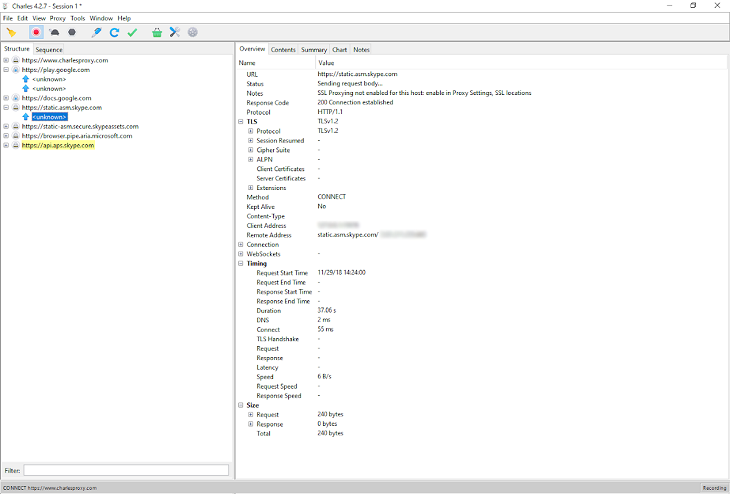
Right after launching, Charles starts monitoring traffic:
We need to be able to monitor traffic coming from the smartphone. Therefore, we’ll start by setting up the iPhone so that it uses our computer with Charles Proxy running as a proxy server.
In Charles, select Help from the tool menu, then go to the SSL Proxying menu and select Install Charles Root Certificate on a Mobile Device or Remote Browser:
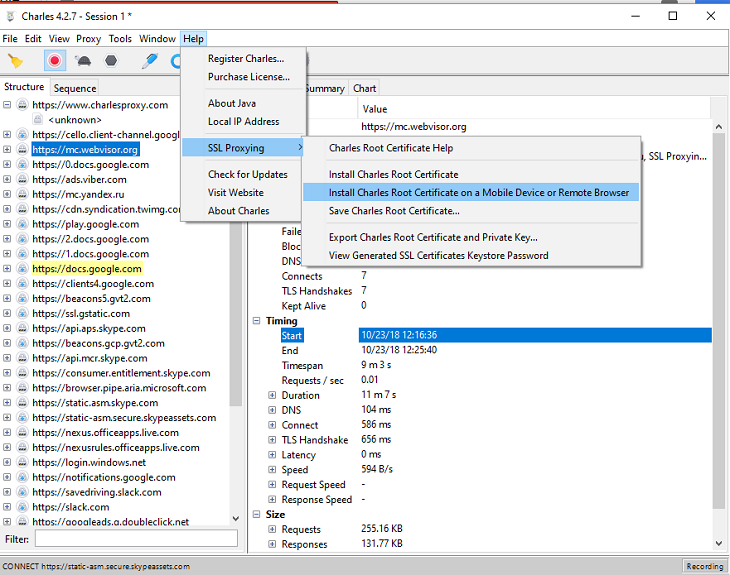
You’ll see a dialog window with the IP address and port for the machine Charles is running on:
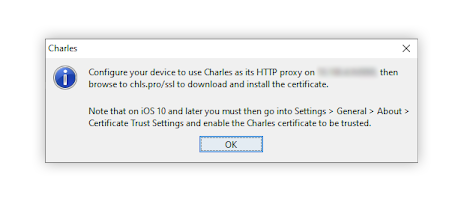
Now on the iPhone, go to the Wi-Fi menu in Settings and make sure the iPhone is connected to the same network as Charles. Click the info icon next to the connected Wi-Fi network and select Configure Proxy.
Select the Manual option and enter the IP address of the server and port provided by Charles on your computer. Click Save to save the changes.
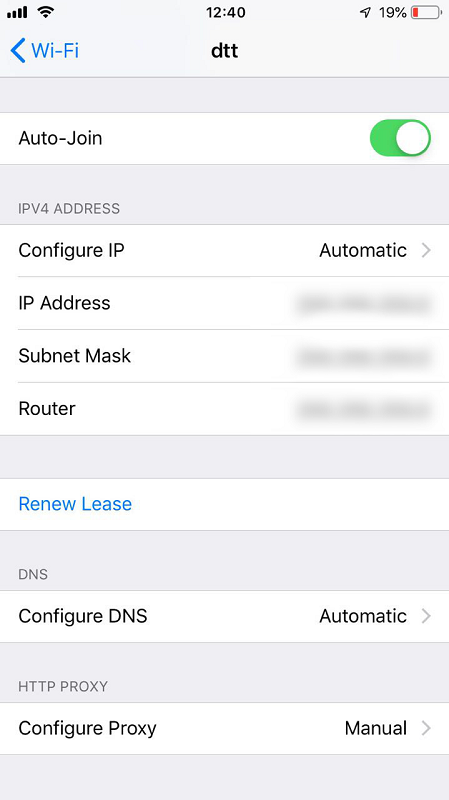
Now your mobile device is configured to route HTTP traffic through the Charles Proxy. After connecting, your computer should display a dialog box warning you that Charles has received an incoming connection and that you need to allow it.
If you’re using iOS 10 or later, you’ll need to install a certificate by selecting Settings> General> About> Certificate Trust Settings> Enable Full Trust for Root Certificates. This will help you monitor the encrypted HTTPS data in plain text. Without the certificate installed, you can only monitor unencrypted HTTP data.
Aside from monitoring traffic between your application and an iOS device, you can use Charles for monitoring and editing application traffic to and from devices running Android, macOS, and Windows. To learn more about the other browser and system configurations of Charles, see the official website.
Conclusion
Fiddler and Charles are among the most popular and widely used web debugging proxies. Both of these tools work great for monitoring HTTPS traffic and have some specific features that a QA specialist may find rather helpful.
QA specialists at Apriorit use popular and trusted application testing tools and constantly expand their knowledge by exploring new testing methodologies. We’ll gladly assist you in solving any type of specialized quality assurance tasks, from testing cloud-based applications and cloud computing applications to testing distributed systems.
Face tricky network activity issues?
Get Apriorit’s help in solving them. Our experienced QA team can deeply analyze the activity of your application, discover reasons for unwanted behavior, and offer actionable advice for fixing it.


