Skip to main content


Discovering and fixing bugs is crucial throughout driver development. This process, called debugging, helps your team to ensure driver quality — but it’s challenging. Your developers must know all the tricks of debugging in both kernel and user mode, as well as choose the most suitable tools.
This is where debuggers come into play. As with any other software product, drivers must be debugged and thoroughly analyzed both during development and after they are built. For these tasks, developers use kernel debuggers. These tools allow them to debug driver code and access all resources of the operating system the debugger is running on.
Although there are many debugging tools out there, in this article, we focus on WinDbg, which is the most popular software for Windows driver debugging. Below, we explore the main reasons for its popularity and explain how to use this Windows debugger. We also show a practical example of code debugging in both kernel and user mode, as well as describe how to analyze crash dump files using WinDbg.
This article will be helpful for project and development leaders working on Windows-related projects and searching for real-life kernel debugging expertise.
Why use WinDbg for driver debugging?
Driver debugging is a vital part of the driver development process. Thorough kernel debugging and debugging in user mode can help your team efficiently identify and correct mistakes in code. As a result, you will be able to:
- Ensure the driver operates correctly
- Enhance its overall speed and responsiveness
- Make sure the driver works well with different hardware and software
- Establish a high level of security and protection
Which tool should I choose for driver debugging?
The three most popular debuggers for Windows are WinDbg, KD, and Visual Studio debugger. All of them work on the same debugging engine and have the same functionality.
Therefore, functionality isn’t the best point of comparison. Speed matters a lot in software development, and this is the factor you can use to identify the best debugger for your project.
Let’s take a quick look at two main factors that influence the speed of debugging tools:
- A graphical user interface (GUI) can significantly accelerate bug discovery as it makes the entire process more convenient and quick for developers. Neither KD nor Visual Studio debugger has a GUI, which slows down debugging. Moreover, preparation for debugging in Visual Studio is much more complicated and takes longer than in similar tools.
- Regular updates improve a tool, helping to simplify and speed up the debugging process. KD and Visual Studio debuggers might receive updates only after a new SDK/WDK version is released. Meanwhile, WinDbg introduces updates frequently, allowing developers to access new opportunities much faster.
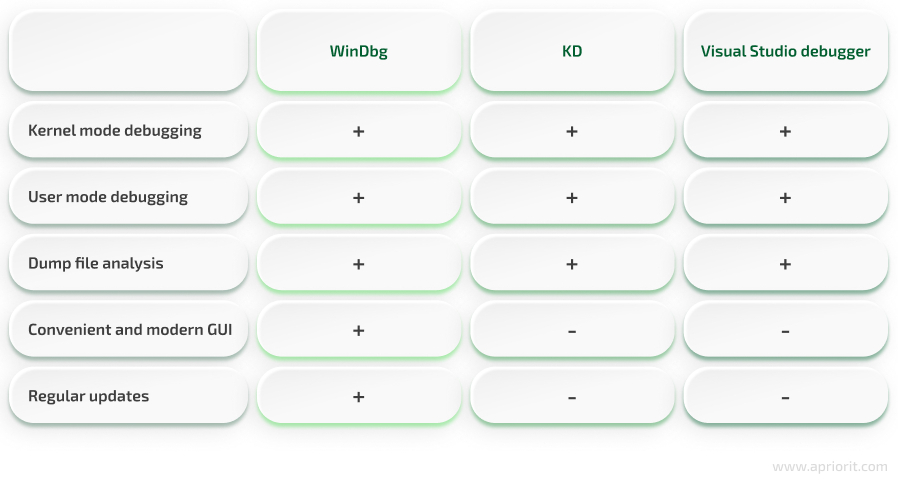
Based on this table, you can see that using WinDbg for kernel debugging is the best option, as it is faster than its competitors. From our experience in Windows driver development, we would also say that WinDbg is much more convenient and efficient to work with than other debuggers. However, if your team is used to working with a different tool, that’s okay, as both KD and Visual Studio offer all features that are essential for proper driver debugging.
Now, it’s time to dive into the details of how to configure and use WinDbg.
Need to deliver a robust driver?
Get yourself a thoroughly designed driver by leveraging Apriroit’s 20+ years of experience in developing, debugging, and testing secure custom drivers for Windows.
How to configure and use WinDbg
In kernel mode debugging, developers gain access to the entire system: its processes, memory, open descriptors, and even threads. Let’s explore how to use such opportunities for efficient driver debugging.
To show a real-life example of how WinDbg works, let’s use the NameChanger driver code sample from the Windows driver samples repository.
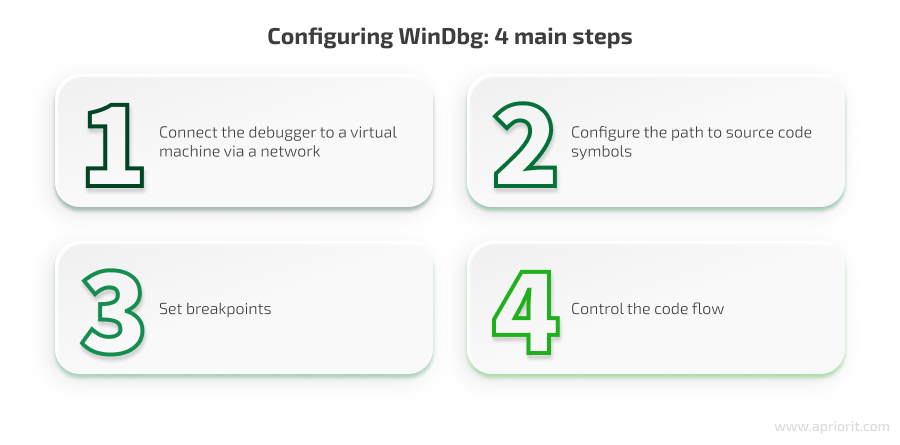
1. Connect the debugger to a virtual machine via a network
Developers usually launch and debug drivers on virtual machines (VMs). They can prepare a virtual machine in the bcdedit command-line tool.
Let’s explore an example of working with bcdedit. We’ll use it to change configuration data during the operating system’s launch. Our goal is to let the operating system launch drivers that are still under development and don’t have signatures. We’ll also show how to start debugging mode and specify the data required to connect the debugger to the kernel.
There are two ways of connecting WinDbg to the operating system’s kernel with the operating system launched in a virtual machine:
- Via the network. Your team can use this option for debugging on remote machines. When working with one machine, debugging via the network is faster than via a COM port. The downside is that your team can use this approach only after uploading the TCP/IP stack to the target machine.
- Via a COM port. Developers choose this way when they need to debug the kernel before uploading the TCP/IP stack to the target machine.
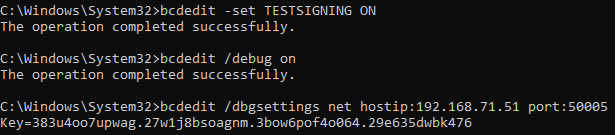
Let’s open Command Prompt in administrator mode to use bcdedit. You can connect to the VM via the network using the following commands:
bcdedit -set TESTSIGNING ONenables test signing mode, which allows Windows to load unsigned drivers.bcdedit /debug onenables kernel debugging in Windows.bcdedit /dbgsettings net hostip:<`hostip`> port:<`portNumber`> key:<`key`>sets an IP address of the host computer’s interface with<`hostip`>, a connection port with<`portNumber`>(we recommend choosing from 50000 and higher), and a key for connection security with<`key`>. If the latter is not specified, a key will be generated randomly.
As a result of these commands, we see the following:
Then, we reboot the VM and connect the debugger to it:
- Launch WinDbg.
- Select File –> Attach to kernel –> Net
- Enter key and port values.
- If you need to debug a remote machine, specify its IP address. If the target VM is connected to the local network, skip this step.
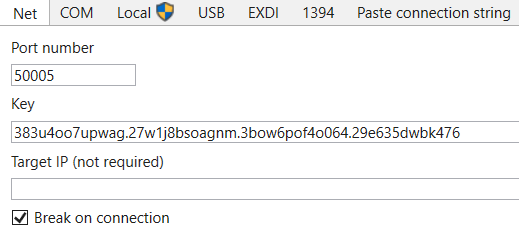
Once we click OK, we see the following message (Screenshot 3) and can type in the command line. The virtual machine should freeze because we checked Break on connection (Screenshot 2). To run the VM, enter F5 or g in the command line.
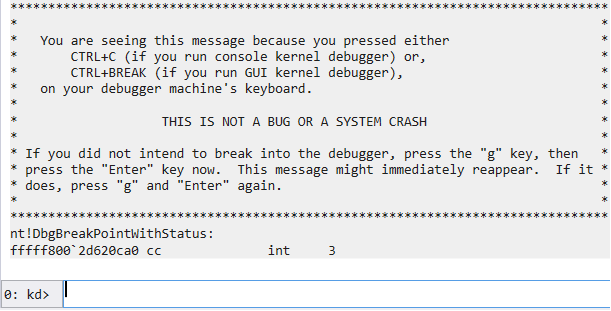
As a result, the debugger stops in the kernel process, causing the entire VM to stop running as well. Now, we can move to debugging our drivers.
2. Configure the path to source code symbols
Now, we need to tell the debugger where to search for the .pdb file for our driver. Without this step, we won’t be able to observe how source code runs during debugging.
To inform the debugger about the path to the folder containing the .pdb file, use the following command:
.sympath+ <`pathToFolderWithPDB`>The .sympath command can help us look up existing paths that the debugger knows about.
Let’s run a command pointing to the folder containing the driver and the .pdb file of this driver:
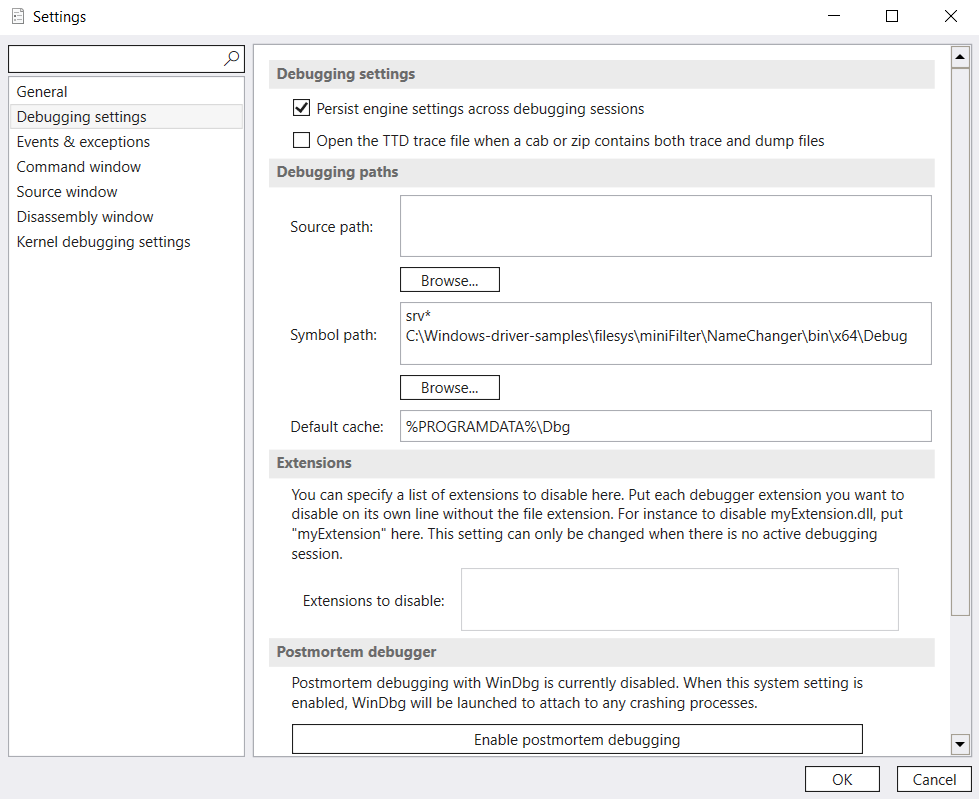
.sympath+ C:\Windows-driver-samples\filesys\miniFilter\NameChanger\bin\x64\Debug Another option is to show the path to the folder with symbols using the user interface:
- Select File –> Settings –> Debugging settings.
- Under Debugging paths, add the path to the target folder with symbols in the Symbol path field.
- Select OK.
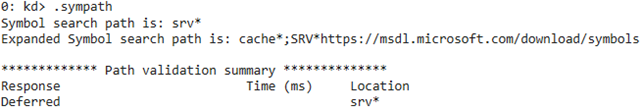
Let’s check that the path has been successfully added:
2: kd> .sympath
Symbol search path is: srv*;C:\Windows-driver-samples\filesys\miniFilter\NameChanger\bin\x64\Debug
Expanded Symbol search path is: cache*; SRV*https://msdl.microsoft.com/download/symbols;c:\windows-driver-samples\filesys\minifilter\namechanger\bin\x64\debug
********** Path validation summary **********
Response Time (ms) Location
Deferred srv*
OK C:\Windows-driver-samples\filesys\miniFilter\NameChanger\bin\x64\Debug
The only thing left to do is upload our symbols by running the .reload command.
3. Set breakpoints
A breakpoint, also known as a pause, intentionally stops or pauses a program so that a developer can check whether it is functioning as expected.
To set a breakpoint, run the following command in the command line:
bp <`moduleName`>!<`functionName`>In this command, <`moduleName`> is the module’s name (NameChanger in our case), and <`functionName`> can be any function in that module. When calling the specified function in the specified module, the entire system under debugging will stop, and WinDbg will return us to the first line of that function.
Let’s see how this works in practice and set a breakpoint on the DriverEntry function in the NameChanger driver using the following command:
bp NameChanger!DriverEntryThen, we use the bl command to check the list of configured breakpoints:
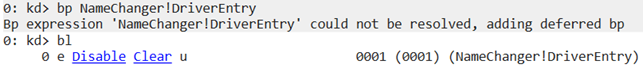
WinDbg tells us that currently it can’t identify the module and function because the module hasn’t been uploaded yet. After this breakpoint has been added, we can enter F5 or g to launch the driver. Once we launch the driver, the system freezes, and the debugger reacts to the DriverEntry function call:
In the bottom left corner, we see the list of local variables and parameters of the DriverEntry function.
You can also make the debugger set a breakpoint on a certain line. Say we want to make the system stop right on line 992. To do that, we need to specify the file name and line:
bp `nc.c:992`Another option is to set a conditional breakpoint on a line. For example, say we want to set a breakpoint on line 992 where the check of the previous operation’s success is located. Let’s add a condition that the system must stop if the Status variable doesn’t have the STATUS_SUCCESS value. Here’s how such a conditional breakpoint looks:
bp /w "Status != 0" `nc.c:992`We must manually specify that STATUS_SUCCESS equals 0, as WinDbg can’t receive information about macro names.
Pro tip: Your developers might want to add a complex condition, having the system stop on a target function when a specific parameter has a certain value. Unfortunately, this won’t work. The reason is that WinDbg sets breakpoints on a spot prior to a function’s entry ー before the function’s parameters are initialized.
Therefore, we recommend placing a breakpoint on a certain line. For example, it could be the first line of a target function. In such a case, all parameters of the target function will already be initialized. Thus, your developers can conveniently explore the data they are interested in when checking how the code works.
4. Control the code flow
Now that we’ve entered and stopped at the beginning of a function, let’s navigate through it.
Here are a few of the main commands that control a function’s execution:
- Step over (F10 or p) ー runs the code one step forward without entering functions
- Step into (F11 or t) ー runs the code one step forward and enters a function if it’s located in the current step
- Step out (Shift + F11 or gu) ー exits a current function and goes one level up through the stack
- Continue (F5 or g) ー continues the function’s running from the current position
- Break (Ctrl + Break) ー stops the function
With general knowledge of how to use WinDbg, let’s move to practical examples.
Related project
Developing Drivers for Low Latency Virtual Reality Headsets
Explore a story of successfully delivered drivers that enable fast data transmission with low latency. Find out how Apriorit helped a client reduce the time to market for their device and receive positive feedback from customers.

Practical example of driver and user program debugging in kernel mode
Say we have a driver that changes the path to a file and we want it to work for all processes other than those in a list of exclusions.
For process identification, we’ll use the process identifier (PID). Let’s say we have already passed a PID to our driver and implemented the bool isProcessToBypass(HANDLE pid) function. This function returns true if a given process is excluded and should not change the path.
The path to a file is passed to the NcPreCreate callback function, which is called when any process attempts to open any file. In this function callback, we have access to requested data, access rights, and information about the process performing the current operation.
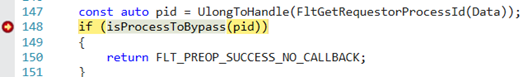
Let’s add the following check to the beginning of the callback function:
const auto pid = UlongToHandle(FltGetRequestorProcessId(Data));
    if (isProcessToBypass(pid))
    {
        return FLT_PREOP_SUCCESS_NO_CALLBACK;
    }
Here’s what happens next:
- We receive the identifier of a process that attempts to open a file using the FltGetRequestorProcessId function.
- We pass a Data parameter of the PFLT_CALLBACK_DATA type to the FltGetRequestorProcessId function.
- The FltGetRequestorProcessId function retrieves the process identifier (PID).
- We pass the received PID to the checking function we added earlier.
- If the checking function returns true, the current function’s execution is stopped and a successful execution status is displayed (with no changes in the callback).
Say we spot that our driver incorrectly handles a certain process. In this case, we can add a condition to the breakpoint installation command, specifying the PID. For example, if the PID is 5000, the command will be:
bp /w "pid == 5000" `nccreate.c:95`From now on, we’ll be brought back to this breakpoint only when the specified process is running. We can also enter the isProcessToBypass function and check step by step whether our process is in the list of exclusions.
Moreover, we can now simultaneously debug the code in both kernel and user mode. In the example above, we have our own process that opens a file. We can observe this execution right from kernel mode without stopping the driver debugging process.
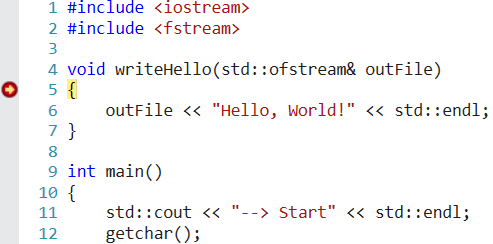
Let’s explore another example. Below, we show a simple code snippet that creates a file and records data to it:
#include <iostream>
#include <fstream>

void writeHello(std::ofstream& outFile)
{
    outFile << "Hello, World!" << std::endl;
}

int main()
{
    std::cout << "--> Start" << std::endl;
    getchar();
    std::ofstream outFile{ "FileName.txt" };
    if (!outFile)
    {
        std::cerr << "Failed to open file" << std::endl;
        return 1;
    }

    writeHello(outFile);

    return 0;
}
Now, we add information about symbols for this user program to the debugger. This is done the same way as for a driver:
- Find the path to the folder containing .exe and .pdb files.
- Add the path to the debugger using the
.sympath+command.
Next, identify the address of the EPROCESS structure of the target process. This address contains the current state of the process in the operating system. Here’s how to find it:
- If PID is known, use the
!process <`PID`> 0command, where the second argument points to the level of information detailing and isn’t obligatory. Since we need minimum information and want to speed up address identification, let’s leave this argument equal to zero. - If only the process’s image name is known, use the
!process 0 0 <`ImageName`>command. The first 0 indicates that the PID is unknown and instructs the program to search among all processes. The second 0 points to the level of information detailing. - If both PID and image name are unknown, use the
!process 0 0.command. This command shows information about all system processes, however, so you’ll need to go through them manually. If you spot the process that interests you, use the Ctrl + Break combination to stop command execution.
Here’s how the received information looks:
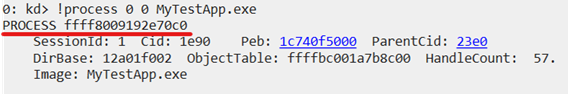
The address after PROCESS is the location within the EPROCESS structure we are looking for.
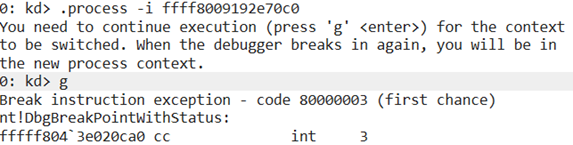
Next, we run the following command:
.process -i <`processAddress`>In this command, <`processAddress`> is the EPROCESS structure’s address.
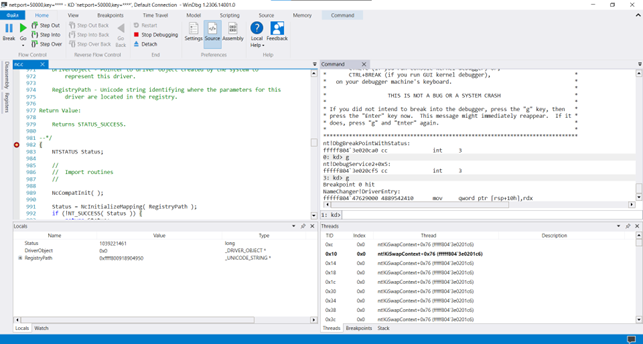
Next, enter F5 or g to focus the debugger on the target process. Here’s what WinDbg should show us at this point:
Now, reload the symbols using the .reload command and set a breakpoint at the writeHello function using the bp MyTestApp!writeHello command. Simultaneously, we will set a breakpoint in the driver to the callback of the function for file opening, with a condition that PID equals our target user process:
bp /w "pid == 0x1e90" `nccreate.c:148`Then, press Enter to continue working with the user program. The driver then shifts the cursor to the place where it checks the file availability in the list of exclusions.
Now, we can follow the checking procedure step by step. To do that, enter F5 or g and find the breakpoint in the user process.
And that’s how driver and user process debugging is done in kernel mode. At this point, developers can also check the data they’re interested in and continue debugging.
Read also
How to Develop a Windows File System Minifilter Driver: Complete Tutorial
Unveil the secrets of developing minifilter drivers for Windows that will show open files in the debug output. Discover helpful insights regarding minifilter drivers that provide the same results as legacy file system filter drivers but require less effort to develop.
Using WinDbg for dump analysis in case of BSOD
Once you configure WinDbg, you can use this tool to explore memory dump files. By analyzing such files during driver debugging, your developers can identify the reason behind system crashes causing the blue screen of death (BSOD) and introduce fixes to eliminate crashes in the future.
These are the main types of memory dump files:
- A small memory dump contains minimum information about the error, drivers, and processes that were active right before the crash, as well as the process and thread that caused the crash.
- A kernel memory dump is bigger than a small memory dump and has more information. It also contains all memory in use by the kernel at the time of the crash.
- A complete memory dump is the largest, taking up space equal to all RAM in use at the time of the crash, plus 1GB, as it contains all physical memory that is used by Windows.
- An automatic memory dump contains the same information as a complete memory dump but differs in that Windows sets the size of the system paging file. If the system paging file size is managed by the system, the system will reserve enough space for a dump file.
- An active memory dump filters out pages that are not likely to be relevant to troubleshooting problems on the host machine. Because of such filtering, an active memory dump is significantly smaller than a complete memory dump.
You can find dump files in the %SystemRoot% folder. To find small memory dump files, go to the %SystemRoot%/Minidump folder and use WinDbg to open them.
Here’s how to configure dump file creation and choose one of the types discussed above:
Advanced system settings –> Advanced –> Startup and Recovery –> Settings
As a result, a new window called Startup and Recovery should be opened, containing all settings we need:
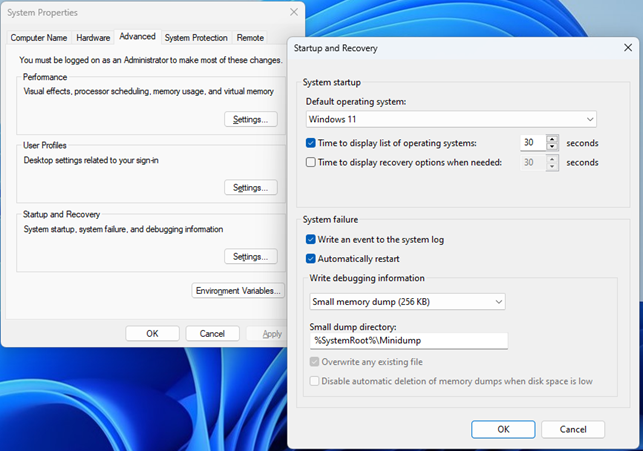
We can keep the default settings shown in Screenshot 12. The only thing we might want to change is the data dump type.
There’s no universal advice on what type of memory dump you should choose, as you always need to decide based on the specific issue you’re trying to resolve. If you only need to find out what the error was and what caused it, a small memory dump will be enough. But if you need to work with the memory itself, consider other options.
Let’s take a look at a practical example.
Imagine we’re facing a NULL pointer dereference, which occurs when an application dereferences a pointer that it expects to be valid but is NULL, usually causing a crash or exit. This is a common issue in development. For example, suppose we expect a certain field (containing required information) to include a pointer to that information. It’s possible that data would be missing or impossible to be received. We need to account for such a possibility or the inquiry will go to an invalid address.
Say we wanted to receive information about some process in the NcPreCreate function but failed to do so, and the pointer was null:
const auto pid = UlongToHandle(FltGetRequestorProcessId(Data));
    if (isProcessToBypass(pid))
    {
        return FLT_PREOP_SUCCESS_NO_CALLBACK;
    }

    PSYSTEM_PROCESS_INFO processInfo{ nullptr };
    // Unsuccessfully trying to get info about a process
    // Didn't check the results
    const auto ppid{ processInfo->InheritedFromUniqueProcessId };
When we go to the line below in the debugger, we see this message:
Here’s what the virtual machine’s screens show us:
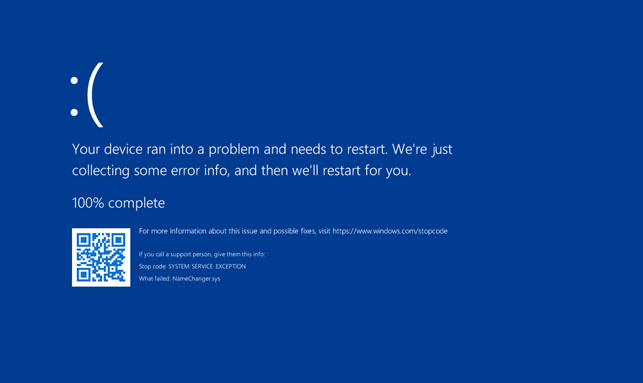
However, we know that the system automatically gathered and stored data on the error in a small memory dump file located in the %SystemRoot%\Minidump folder.
Let’s copy and open this file on the host machine using WinDbg. We start with checking the symbols, as they can be configured separately when opening dump files. Here’s what we see:
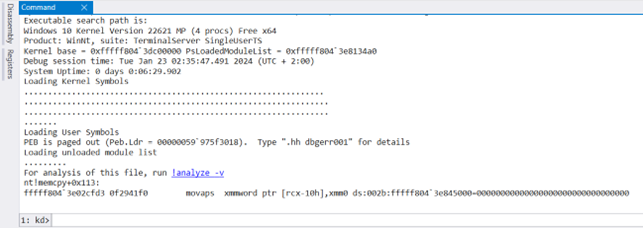
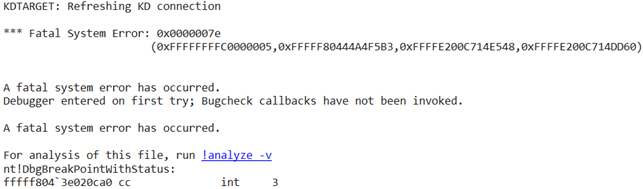
Then, we run !analyze -v and see more information about the system crash:
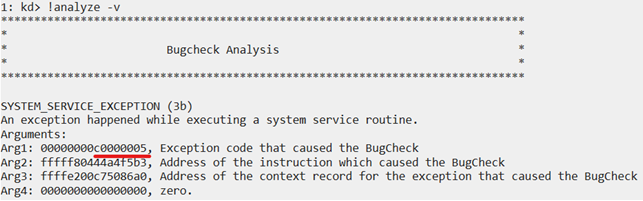
Right off the bat, we see the exception code: SYSTEM_SERVICE_EXCEPTION (3b). The first argument of this exception code is the error code: c0000005 (STATUS_ACCESS_VIOLATION). Since this error stands for access rights violations, it’s possible that it occurred because we tried to read invalid memory.
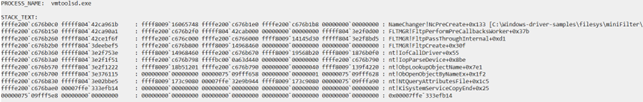
Next, let’s take a look at:
- The process in the context of the error
- The stack containing the function where the error occurred
- The path to the file
Finally, let’s examine the place in the code where the error occurred:
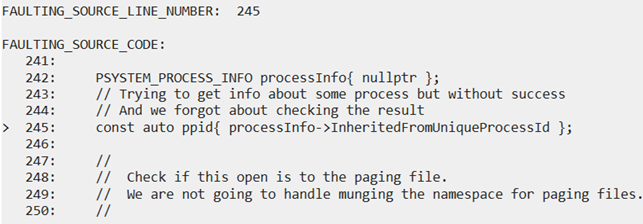
By analyzing the small memory dump file, we managed to find useful information about the error that caused the system crash. Knowing how to analyze memory dump files and where to look for them helps developers find and fix the cause of many issues, preventing further system crashes.
Related project
Improving a Windows Audio Driver to Obtain a WHQL Release Signature
Discover the details of how a British audio technology company secured successful Microsoft certification thanks to Apriorit’s thorough development and QA efforts.

Tips for working with descriptors
Apart from what we’ve already discussed, there are a few more useful tips and tricks you can use to speed up debugging, leading to accelerated driver development. One of them is knowing how to work with descriptors during WinDbg kernel debugging.
Let’s explore an example of working with descriptors using the NcPreCreate callback. When entering this callback, we find ourselves in the context of the process that runs the operation. Here, we can access the list of all opened descriptors of this process using the !handle command.
With no arguments, !handle will simply return all process descriptors, which will take too much time. Therefore, we need to make our request more specific:
- The first parameter is the descriptor. But since we’re looking for it, let’s set 0 for all descriptors.
- Next comes bitmask, the parameter indicating the level of detail in the output. Let’s set this value to 3, which stands for basic information about the descriptor and the object the descriptor points to.
- Then, we specify the identifier of the process we’re interested in or set a value of 0 if we are seeking information about all processes. For our example, let’s specify the text process that opens FileName.txt. Its identifier is 218c.
Finally, we specify the object type described by the descriptor. It could be Event, Section, Port, Directory, etc. For our example, let’s choose File.
Here’s our final request:
!handle 0 3 218c FileLet’s run it:
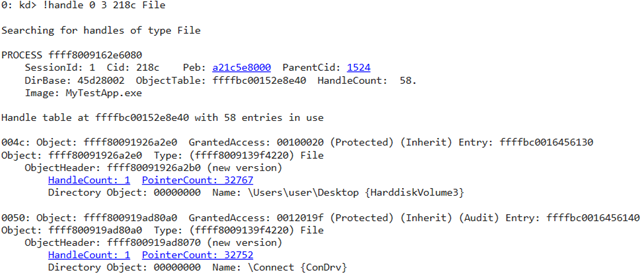
After looking through all file descriptors of the current process, we find the descriptor of the FileName.txt file. Let’s analyze it:
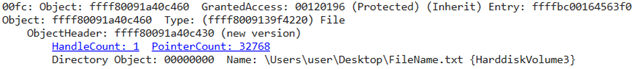
First, we want to find out which process owns this descriptor. To do that, we can run the !findhandle ffff80091a40c460 command or click the HandleCount: 1 line.
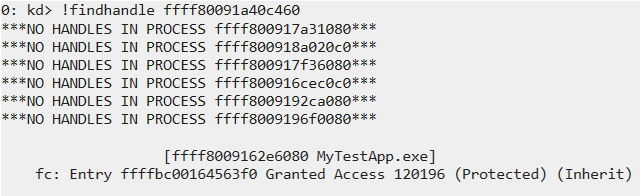
Now, we know that the MyTestApp.exe process owns this descriptor. In the screenshot above, we can also see the path to the file received by this process.
Another important command to know about is !thread. This command can help us analyze information about threads, which is crucial when finding and fixing errors.
Without any parameters, the !thread command will only provide information about the thread we’re currently in. However, we can specify a certain process if we need some specific information.
Say we’re currently in the NcPreCreate callback and want to analyze the thread that runs our code.
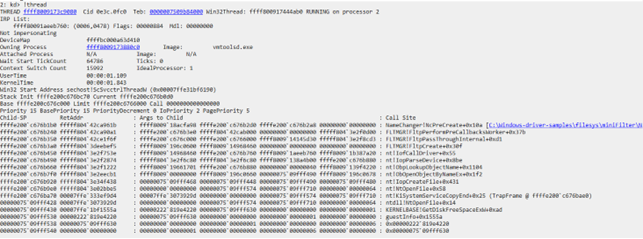
Here, we can see what kernel this thread runs on, its priority, its context, and the stack that includes our callback.
Additionally, we can receive information regarding the thread’s security using the !token command. This command will show us the user and group the thread belongs to, as well as its privileges. This data can help us significantly simplify the search for errors when troubles occur in kernel mode.
Another helpful command is !peb, which provides general information about threads. The PEB structure stores useful information such as:
- Program image address
- List of uploaded modules
- Process image name
- Process command line
- Process environment variables
Last but not least, the !irql command also helps to find errors. It provides information about the current interrupt level of the thread.
Knowing how to use these commands can help your team collect useful information about troublesome processes, efficiently fix discovered issues, and ensure comprehensive debugging for your driver.
Related project
Developing a Custom Driver Solution for Blocking USB Devices
Explore a success story of developing a driver for managing USB ports and blocking restricted devices to enhance a client’s enterprise product. Discover how Apriorit helped the client increase product value and the company’s competitive advantage.
How Apriorit can help you with driver development
Apriorit has more than 20 years of experience developing custom drivers from scratch and helping clients enhance their existing driver solutions. Over the years, we have successfully delivered projects of different complexities. Our engineers work on various low-level development projects not only for Windows but for macOS and Linux as well.
We know how to approach each development process, including debugging in both user and kernel modes.
We can help you develop and improve the following types of products:
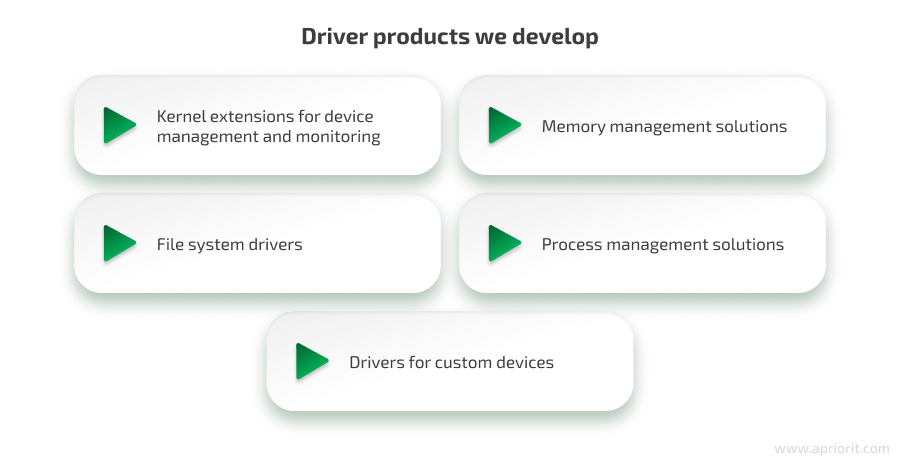
To make sure the final solution meets all your requirements and works flawlessly, we carefully plan the pre-release driver debugging process. During this step, we thoroughly analyze failed tests, fix all discovered bugs, check the driver’s performance, and ensure all security measures are in place.
Apart from the conventional practice of product debugging, Apriorit developers also explore new options and practice other approaches like time travel debugging. We treat each project as a mission, choosing the most suitable technology stack and practices based on your goals and requirements.
Conclusion
Kernel debugging is crucial during driver development. Using the most suitable tools for this process will help your team detect and fix errors, delivering a reliable solution. From our experience, WinDbg is usually the best option for debugging when working on Windows drivers.
At Apriorit, we have professional kernel and driver development teams who know all the tips and tricks of kernel debugging with WinDbg. We are ready to assist you with delivering a project of any complexity and solving tricky driver development and debugging-related tasks.
Need help creating a new driver or improving an existing one?
Entrust your project to Apriorit driver and kernel development experts. Receive an efficient and secure product that meets both your business goals and technical requirements.